Amazon Sales Insight - Dashboard in PowerBI
Analyzed and vizualized Amazon Sales data in India and created a Dashboard leveraging DAX measures
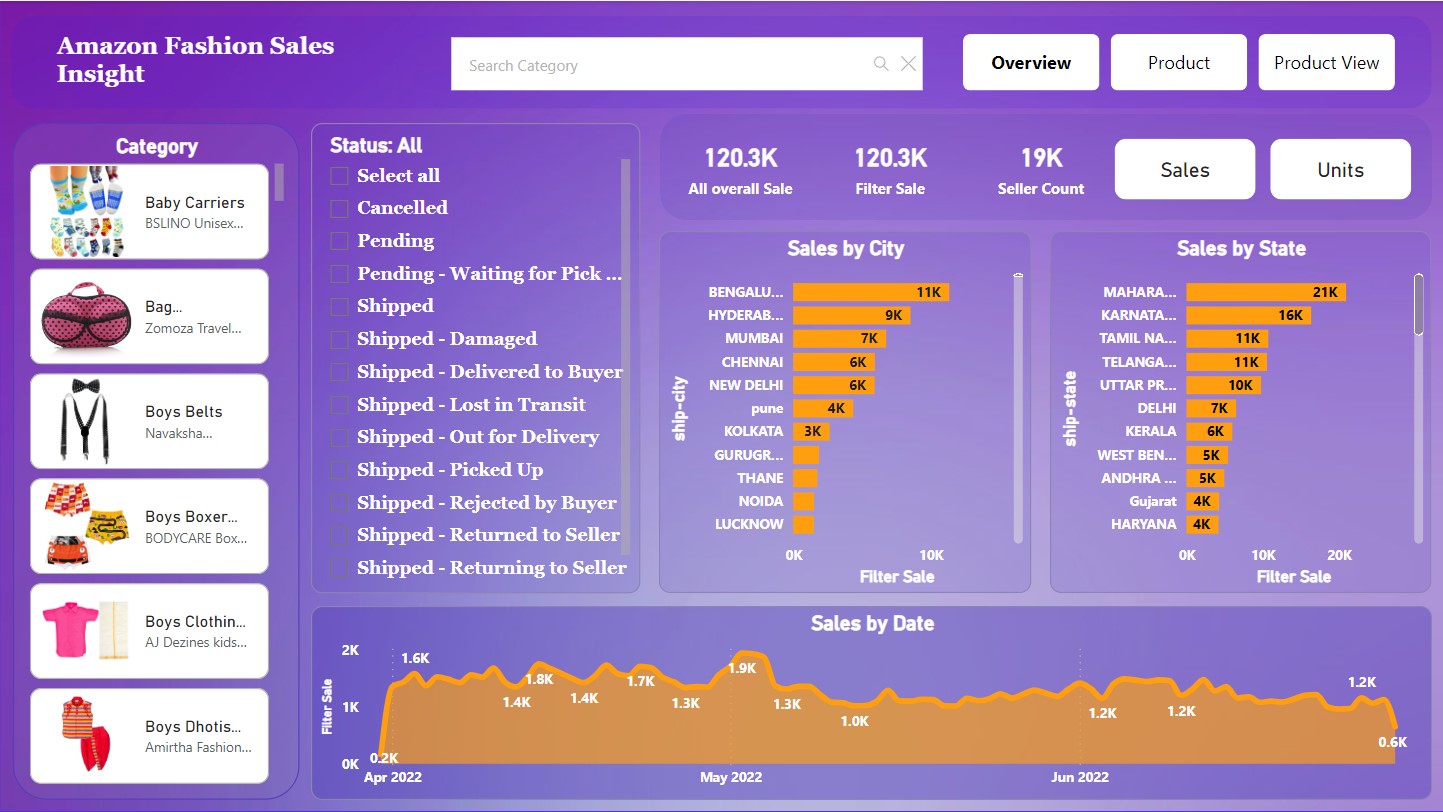
The first dashboard offers a comprehensive analysis of sales performance, providing stakeholders with valuable insights into product category trends and order fulfillment efficiency. Through visualizations such as sales by category and order status breakdowns, users can identify top-performing categories and track order processing effectiveness. Geographical analysis further enhances decision-making by highlighting regional sales patterns. With features like the text search slicer enabling dynamic data filtering, this dashboard facilitates targeted exploration of sales data, ultimately supporting strategic decision-making to optimize sales strategies and enhance overall business performance.
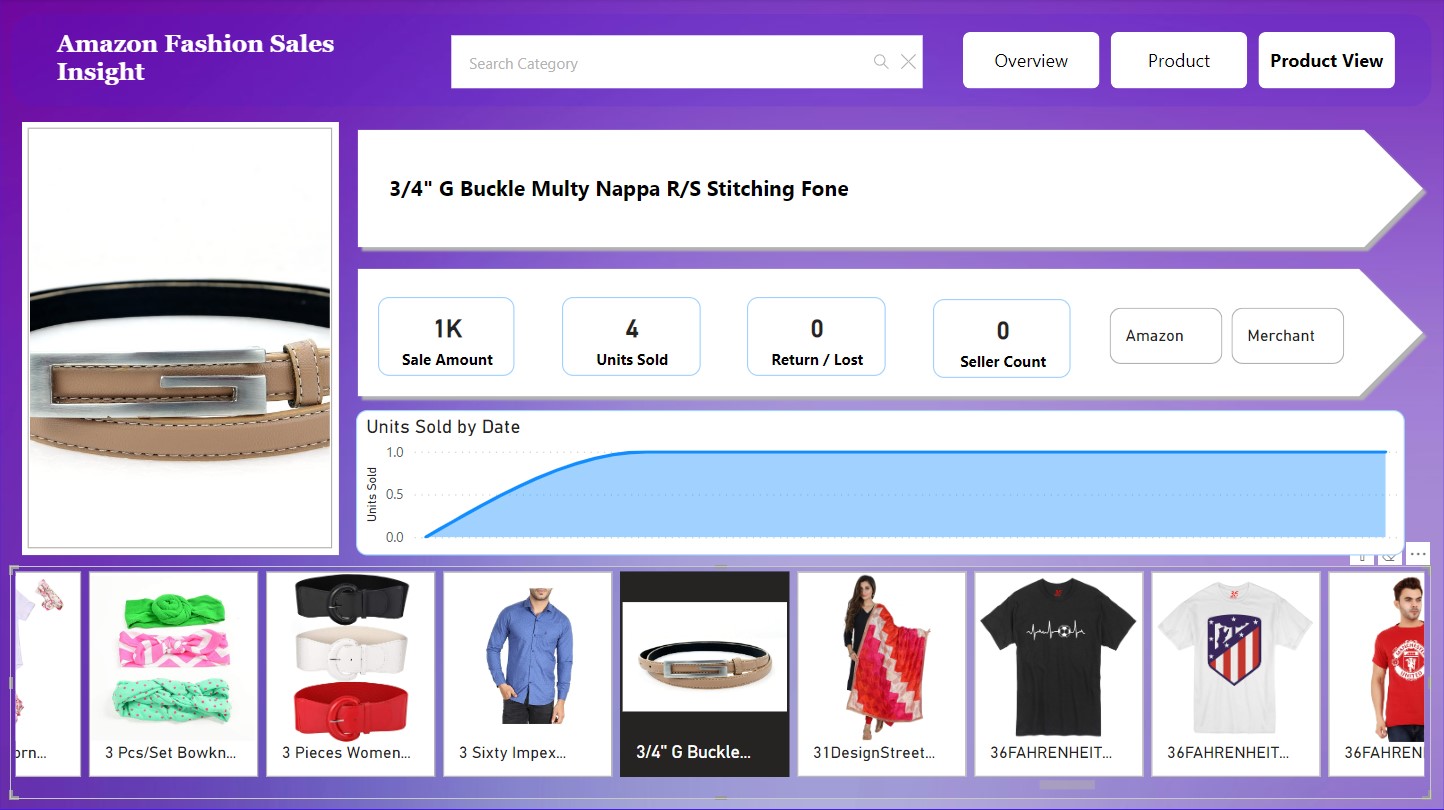
The second dashboard offers a comprehensive overview of product sales, utilizing dynamic visual elements and detailed data summaries to facilitate in-depth analysis. Through the incorporation of image-based slicers and intuitive navigation features, users can seamlessly explore product sales data with enhanced visual representation. The area chart depicting sales trends over time provides valuable insights into product performance dynamics, while the accompanying sales summary cards offer concise snapshots of key metrics. Additionally, the inclusion of product descriptions alongside sales data enhances decision-making by providing context and additional insights. Overall, this dashboard serves as a powerful tool for stakeholders to evaluate individual product performance, identify sales trends, and make informed strategic decisions to optimize business outcomes.